|
|
 |
|
 |
 |
 |
 |
 |
 |
 |
 |
 |
 |
 |
 |
 |
 |
 |
 |
 |
 |
 |
 |
 |
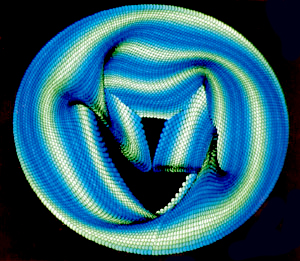 |
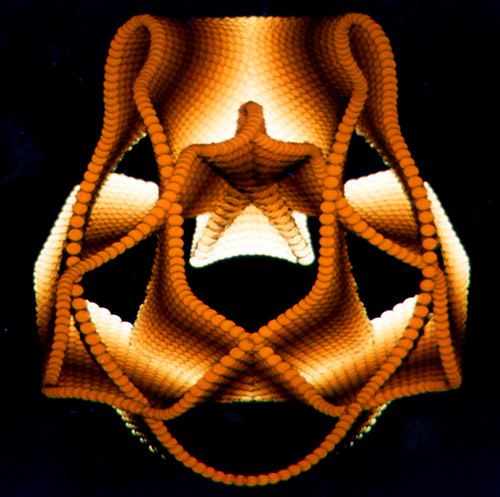
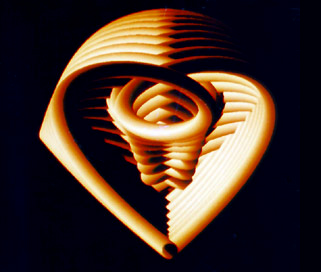
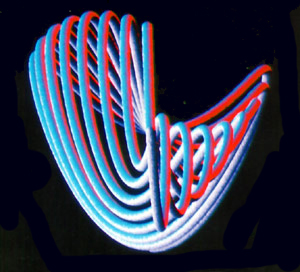
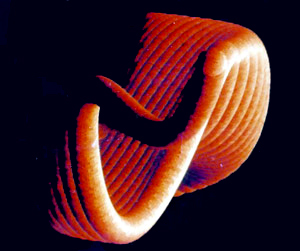
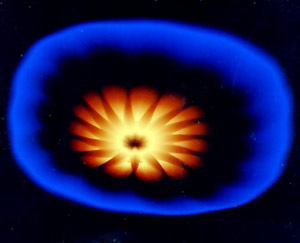
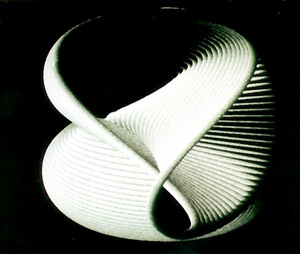
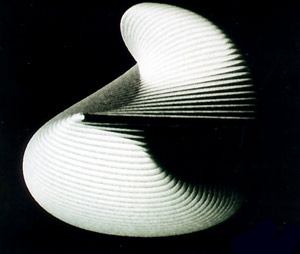
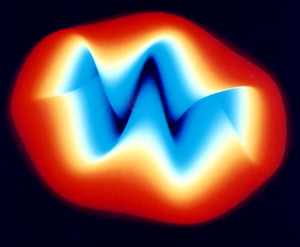
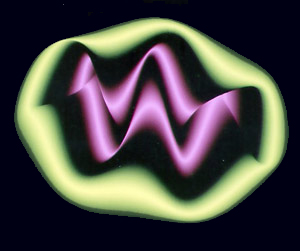
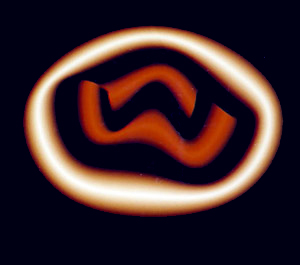
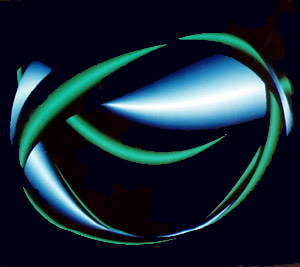
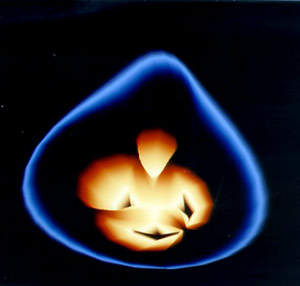
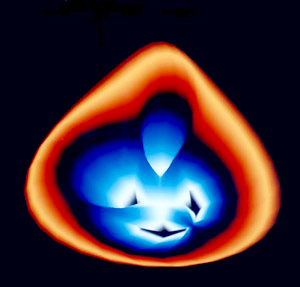
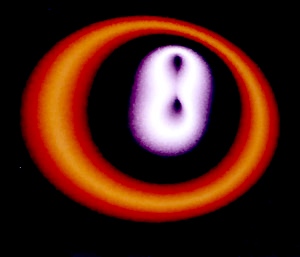
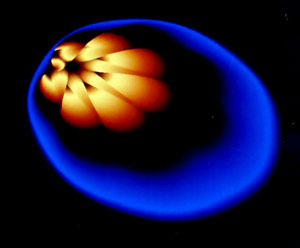
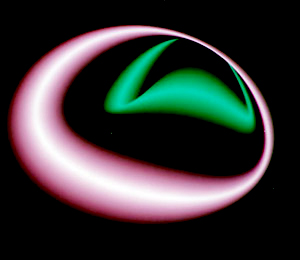
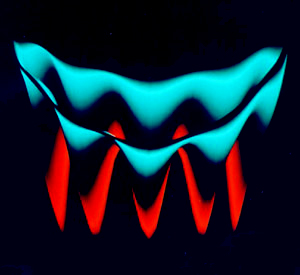
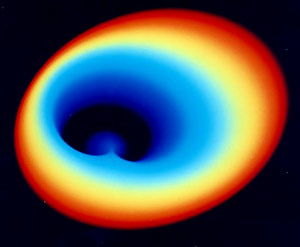
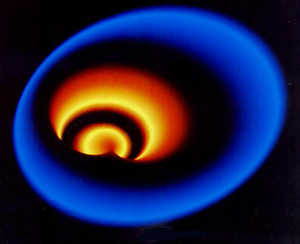
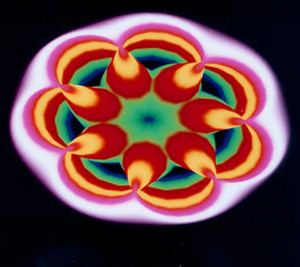
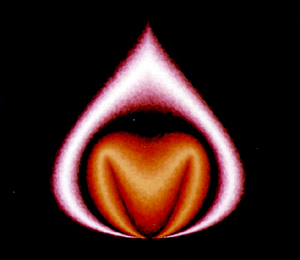
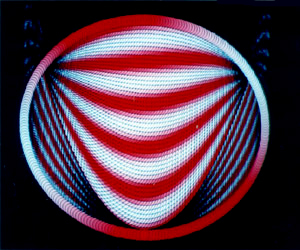
Lissajou′s FiguresW(Wikipedia) Lissajous curve (Lissajous figure or Bowditch curve) is the graph of the system of parametric equations which describes complex harmonic motion. This family of curves was investigated by Nathaniel Bowditch in 1815, and later in more detail by Jules Antoine Lissajous in 1857. The appearance of the figure is highly sensitive to the ratio a/b. For a ratio of 1, the figure is an ellipse, with special cases including circles (A = B, δ = π/2 radians) and lines (δ = 0). Another simple Lissajous figure is the parabola (a/b = 2, δ = π/2). Other ratios produce more complicated curves, which are closed only if a/b is rational. The visual form of these curves is often suggestive of a three-dimensional knot, and indeed the many kinds of knots, including those known as Lissajous knots, project to the plane as Lissajous figures. Lissajous figures are sometimes used in graphic design as logos. Examples include the logos of the Australian Broadcasting Corporation (a = 1, b = 3, δ = π/2) and the Lincoln Laboratory at MIT (a = 4, b = 3, δ = 0). Prior to modern computer graphics, Lissajous curves were typically generated using an oscilloscope (as illustrated). Two phase-shifted sinusoid inputs are applied to the oscilloscope in X-Y mode and the phase relationship between the signals is presented as a Lissajous figure. Lissajous curves can also be traced mechanically by means of a harmonograph.
of CH1 and b is frequency of CH2, so a / b is a ratio of frequency of two channels, finally, δ is phase shift of sin curve of CH1. |
|